
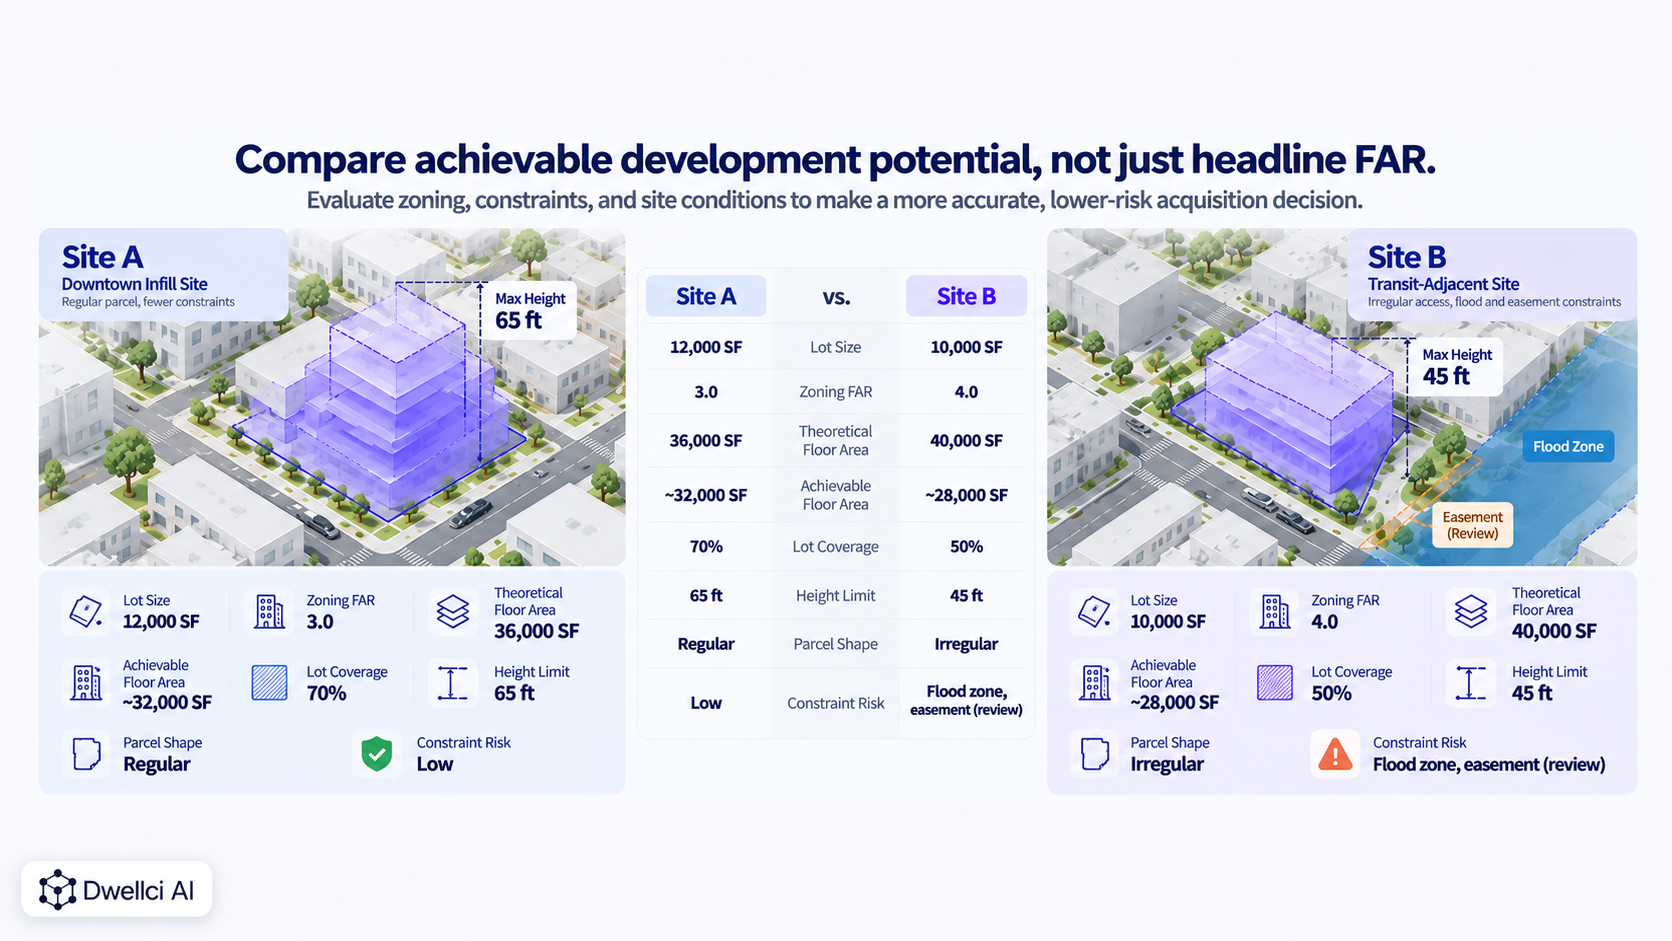
Comparing development sites before acquisition requires more than putting lot size, zoning district, and asking price side by side. The strongest comparison normalizes the same development assumptions across each property, tests what can actually fit, identifies the constraints and approvals that could change the outcome, and separates verified facts from assumptions.
For an acquisition team, the practical question is:
“Which site offers the strongest risk-adjusted development potential—not just the most attractive headline zoning?”
Compare each site using the same framework:
The winning site is not necessarily the one with the highest FAR, lowest purchase price, or largest lot. It is the one that best supports the intended development program after constraints, uncertainty, and economics are considered together.
A site comparison is only useful if the assumptions are comparable.
Before ranking properties, define a common program such as:
If Site A is tested as a 40-unit multifamily project while Site B is tested as a 25-unit concept with different unit sizes and parking assumptions, the comparison may say more about the assumptions than the sites.
Start with a consistent development program, then let each site's zoning and constraints determine how that program changes.
Gross lot area is important, but parcel geometry can change the value of every square foot.
Compare:
EPA's redevelopment guidance identifies parcel boundaries, property features, encumbrances, access, and physical conditions as core inputs to real estate due diligence because they can affect whether a proposed reuse is achievable. EPA's Reuse Assessment guidance provides a useful framework.
A regular 20,000-square-foot parcel may be more efficient than a larger but narrow or irregular site.
Do not start with FAR if one of the sites may not permit the intended use.
For each property, verify:
A site with excellent density but a complicated entitlement path may be less attractive than a slightly lower-density site that supports the program as-of-right.
For a systematic review, see Zoning Due Diligence Checklist for Developers.
Headline FAR is a useful starting point, but developers should compare what appears achievable after dimensional and site constraints are applied.
For each property, track at least:
A property with 4.0 FAR that can only use 2.8 efficiently may be less attractive than a property with 3.2 FAR that can use nearly all of it.
For the distinction between permitted and usable floor area, see Floor Area Ratio (FAR): What Developers Need to Know.
The buildable envelope shows whether the site's zoning capacity can physically fit.
Compare the effect of:
Two sites with the same lot area and FAR can produce very different three-dimensional envelopes.
A useful comparison therefore includes a plan or 3D representation of the zoning-defined development volume rather than relying only on numerical zoning tables.
See What Is a Buildable Envelope?, FAR vs. Lot Coverage, and How Setbacks Affect Development Yield for the main geometric controls.
Zoning is only one layer of site feasibility.
Compare major physical and environmental conditions such as:
EPA notes that contamination, topography, regulated flood zones, and parcel dimensions can affect developable area and project viability. EPA's Site Conditions and Feasibility guidance provides one example of how physical conditions change the usable development area.
The important comparison metric is not simply whether a constraint exists, but how much it changes the development scenario and what uncertainty or cost it introduces.
For the distinction between regulatory overlays and physical, environmental, legal, or infrastructure constraints, see Zoning Overlays & Site Constraints.
A site can support the building envelope but still struggle operationally.
Compare:
EPA's redevelopment guidance treats access and infrastructure as important property attributes because they can create either opportunities or redevelopment constraints. The Reuse Assessment recommends evaluating those conditions together with zoning and other site characteristics.
Not all buildable floor area carries the same entitlement risk.
For each site, classify the development path as something like:
Also compare the expected effect on timing.
A site that produces more units but adds a long and uncertain approval process may not be superior once carrying costs, option periods, consultant costs, and execution risk are considered.
Do not compare one site by units and another by square footage.
Use a consistent set of outputs such as:
The goal is to create an apples-to-apples picture of what each site may support under the same development program.
Purchase price alone is not a useful site-comparison metric.
A more informative early metric is land basis relative to the development capacity that appears achievable.
For example:
Land basis per achievable buildable SF = acquisition price ÷ preliminary achievable floor area
Or, for residential projects:
Land basis per estimated unit = acquisition price ÷ preliminary unit yield
These are still preliminary metrics, but they can expose sites that look inexpensive only because the denominator has not been tested.
Use them alongside—not instead of—a full financial model.
This distinction can materially change the ranking.
Suppose:
Based only on theoretical FAR:
Site B appears much cheaper.
But now assume preliminary feasibility indicates:
Using achievable floor area:
The apparent pricing advantage disappears.
This simplified example shows why site comparison should not stop at theoretical zoning capacity.

Two sites with identical projected yield should not be ranked equally if one result is based on verified inputs and the other depends on unresolved assumptions.
For each material input, label it:
Then assess how much the site ranking depends on unresolved items.
A site with slightly lower yield but higher confidence can be a stronger acquisition candidate than a site whose apparent upside depends on multiple unverified assumptions.
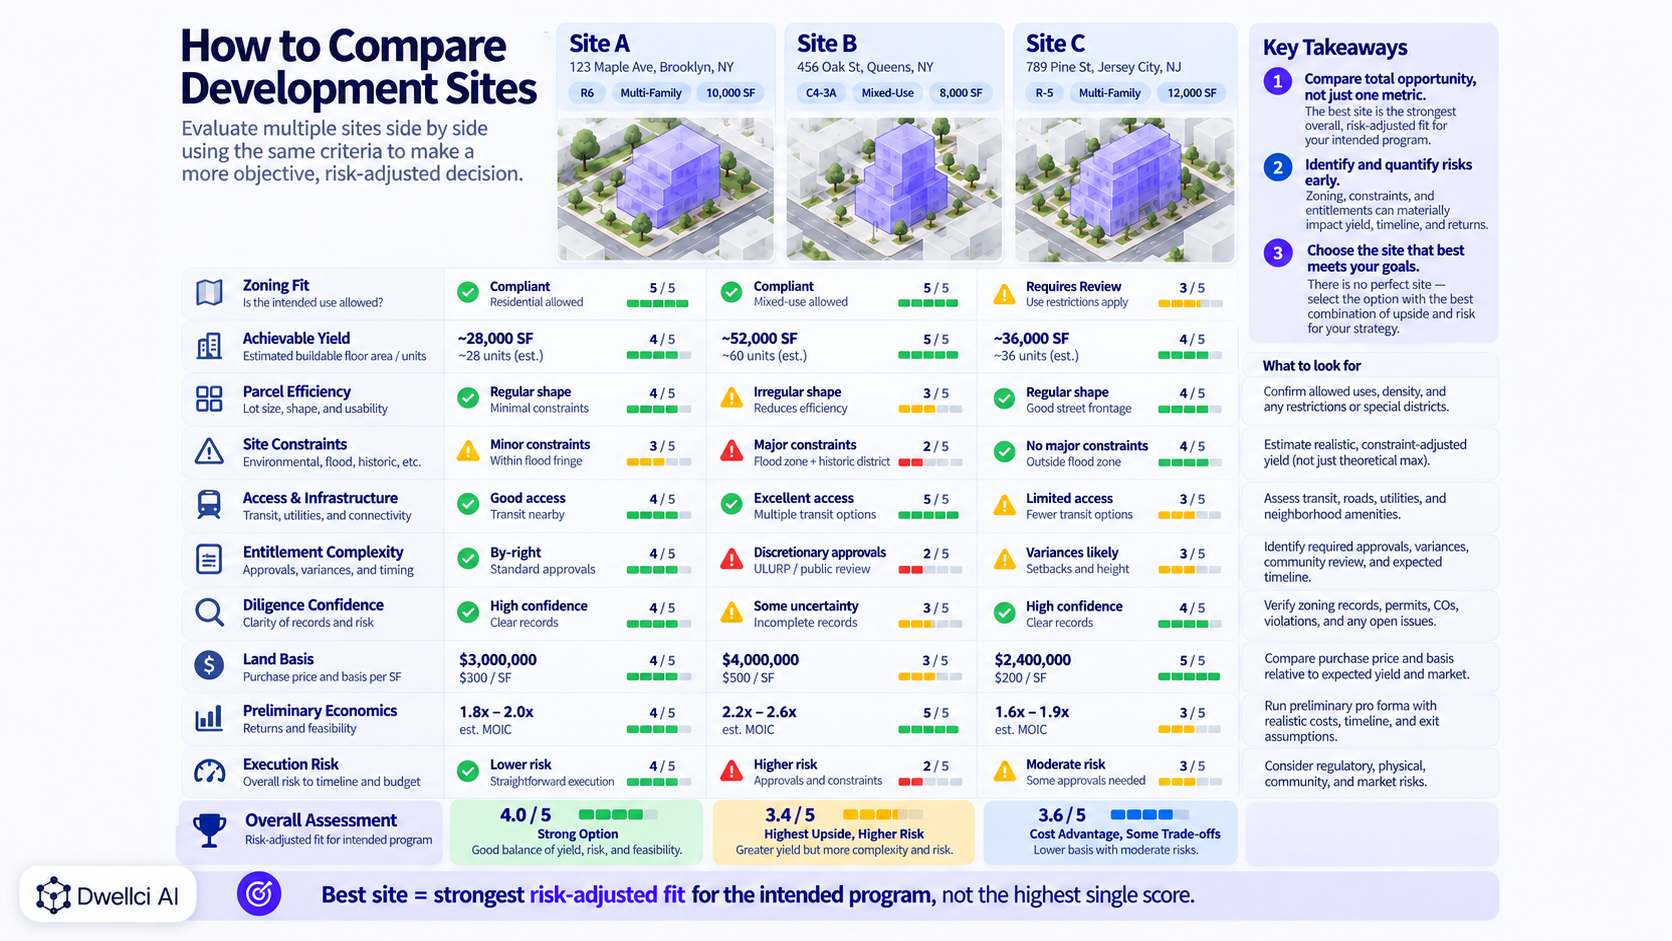
A simple comparison matrix can make tradeoffs visible.
For each site, score or summarize:
The score itself is not the answer. Its purpose is to force the team to compare each site using the same questions.
EPA's reuse-planning guidance similarly recommends evaluating scenarios based on risks, liabilities, market viability, and economics rather than assuming a project is feasible merely because some constraints can be resolved. EPA's Reuse Plan guidance provides a useful parallel.
Consider two illustrative multifamily acquisition opportunities:
The theoretical zoning capacity is:
On FAR alone, Site B appears stronger.
But a preliminary massing comparison might show:
Site A may therefore capture a larger share of its zoning capacity and offer a simpler development path despite the lower headline FAR.
The correct conclusion is not automatically “buy Site A.” It is that Site A deserves to rank differently once geometry, constraints, entitlement risk, and the confidence of the inputs are considered.
Common site-comparison mistakes include ranking properties primarily by:
Each may matter, but no single metric captures development potential.
A strong acquisition decision considers the interaction between zoning capacity, physical fit, risk, cost, timing, and certainty.
A constraint on one site can be an opportunity in another development strategy.
EPA's redevelopment guidance makes this point explicitly: property features should be evaluated as opportunities and constraints relative to the intended reuse, and missing information should be treated as a data gap rather than ignored. The opportunities-and-constraints framework is useful for development-site comparison as well.
For example:
A repeatable workflow is:
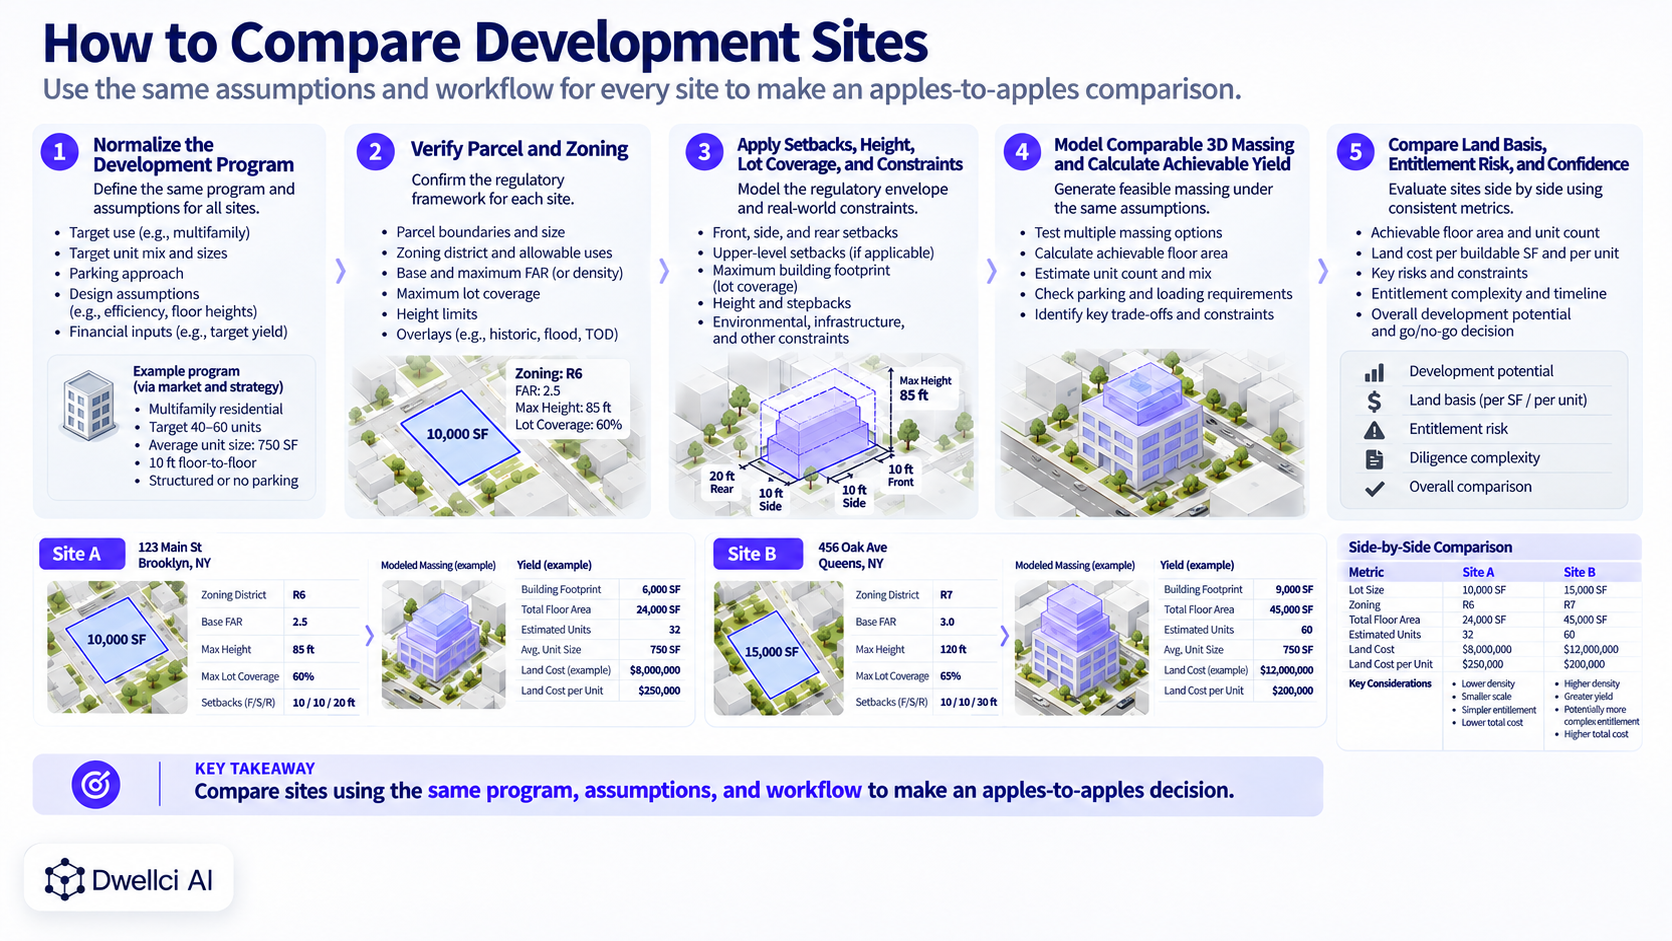
For the broader site-by-site screening process, see How to Evaluate a Development Site Before Acquisition.
Dwellci AI is designed to help development teams evaluate multiple opportunities using a consistent phase-zero feasibility framework.
The platform combines parcel intelligence, zoning analysis, site constraints, and zoning-backed 3D massing so teams can compare what each site appears capable of supporting before committing significant capital or detailed design effort.
The objective is not to replace zoning counsel, architects, engineers, environmental professionals, surveyors, or financial underwriting.
It is to help acquisition teams compare opportunities earlier with a clearer view of buildable potential, constraints, and uncertainty.
There is no single best metric. A useful comparison combines achievable floor area or unit yield, zoning and entitlement risk, site constraints, access and infrastructure, land basis, economics, and the confidence level of the assumptions.
Use both. Permitted FAR shows the theoretical zoning capacity. Achievable FAR shows how much of that capacity appears to fit within the actual site's dimensional and physical constraints.
In early screening, compare acquisition price against both theoretical and preliminary achievable development capacity, such as price per achievable buildable square foot or price per estimated unit. A full investment decision still requires a complete financial model.
Not necessarily. Higher risk may be justified by greater upside, lower basis, or a strategic advantage. The important step is to make the risk explicit and compare it against the potential return rather than ignoring it.
Ideally during initial acquisition screening and again as diligence improves. The ranking should be updated as assumptions become verified, constraints are resolved, and better cost or market information becomes available.